I have been doing a lot of CFD lately. I have quickly learned that the information one can gain from CFD is far more insightful to the physicals then 0D, lumped parameter equations.
One tool I have been using is Agros2d. It can do 2d axis symmetric and planar PDE problems. Agros2d can handle incompressible steady and unsteady CFD.
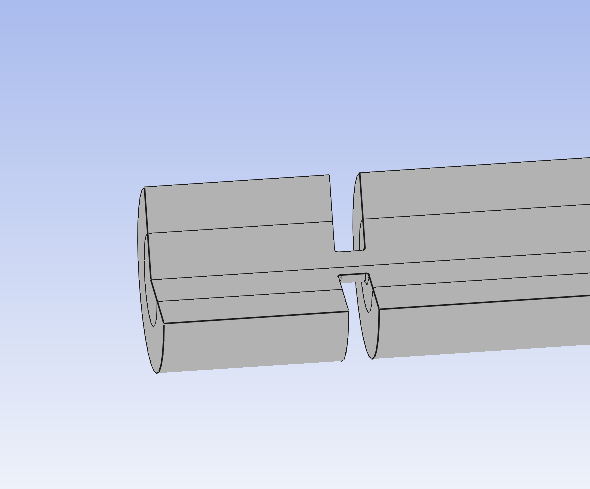
As an example, orifice problem has been studied many times. However, it usually isn’t studied from the point of view of an axis symmetric CFD.
The inlet boundary condition is a max velocity of 1.5m/s with a parabolic profile (1-(r/R)^2)*1.5m/s. R is the radius of the pipe 0.003m.
The Agros2d model is attached here: Orifice.a2d. You should be able to open the model with Agros2d and hit the “Solve” button in the lower left hand corner.
Below are some the results from the simulation.
.
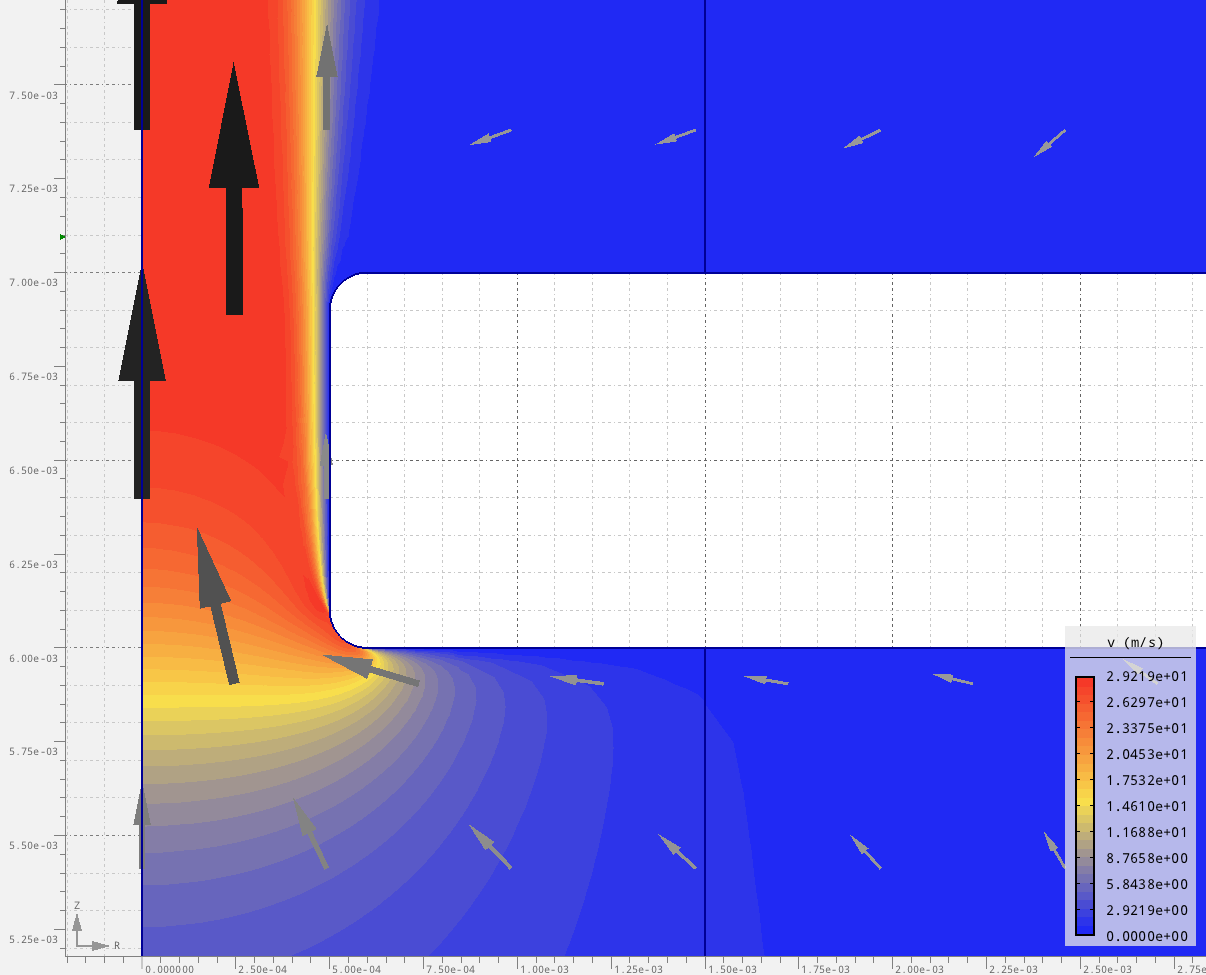
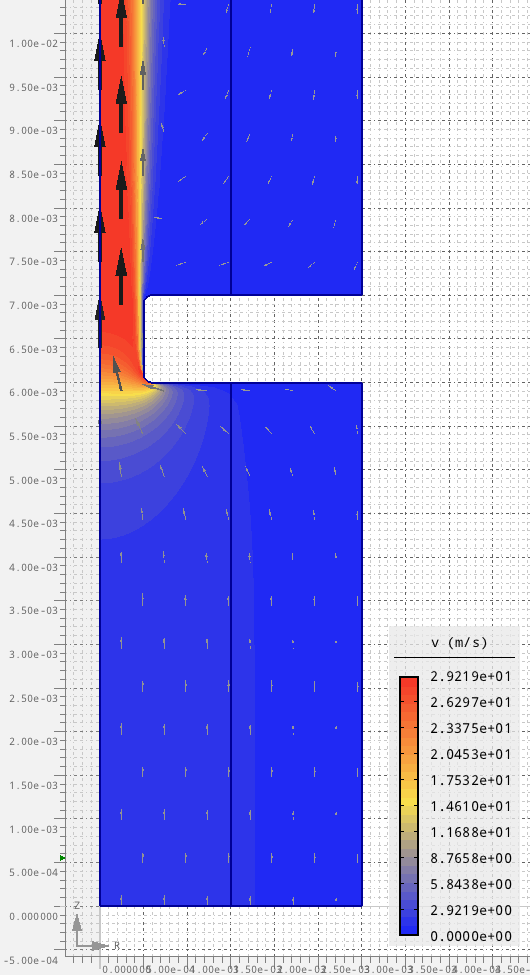
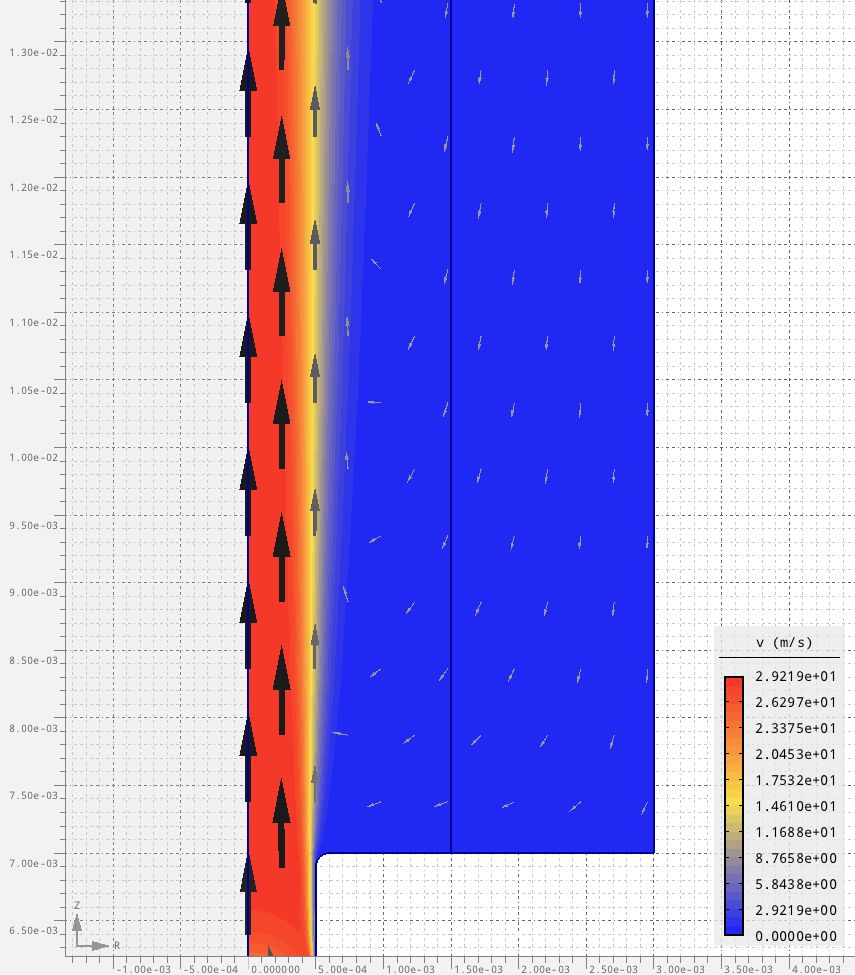
Velocity color plot at the throat. Notice that there is a dead space between the wall and the stream. The thinnest part of the stream is known as the vena contracta. See the next picture to see the velocity profile across the center of the throat.
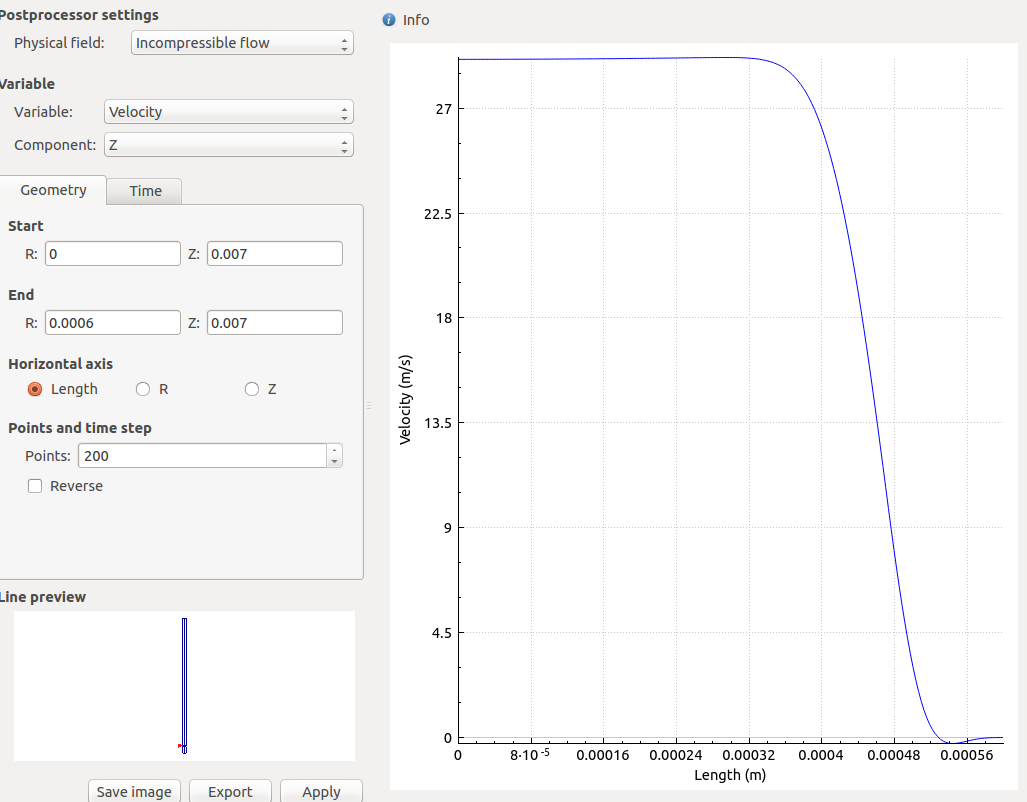
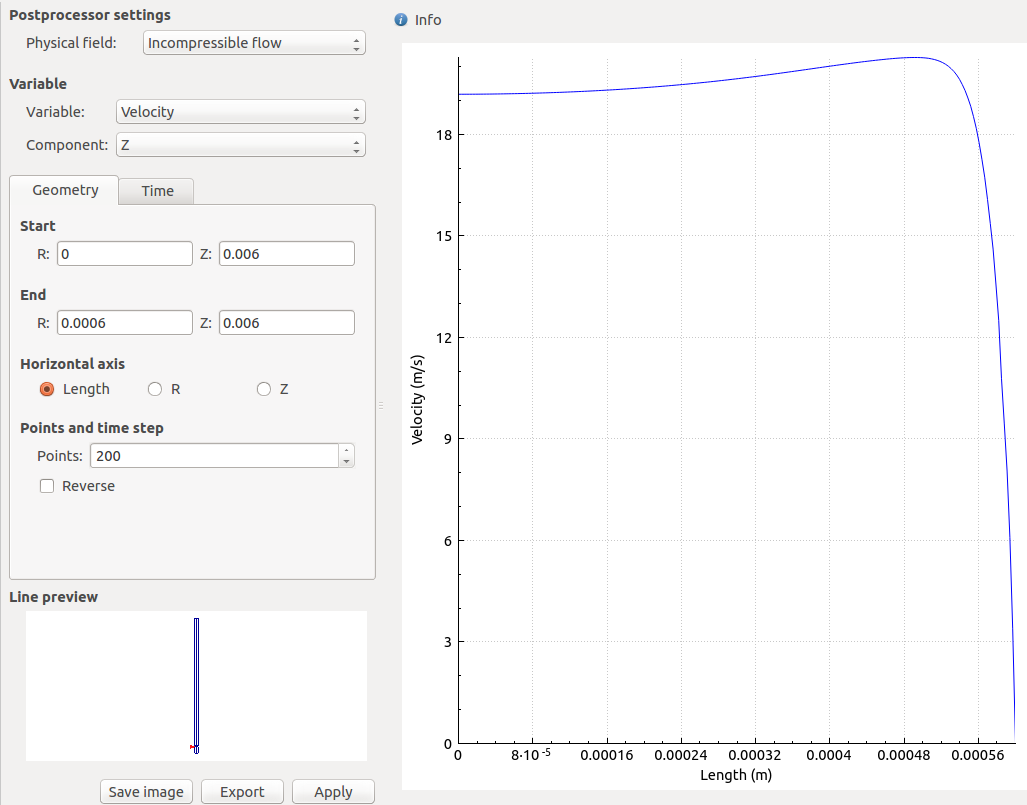
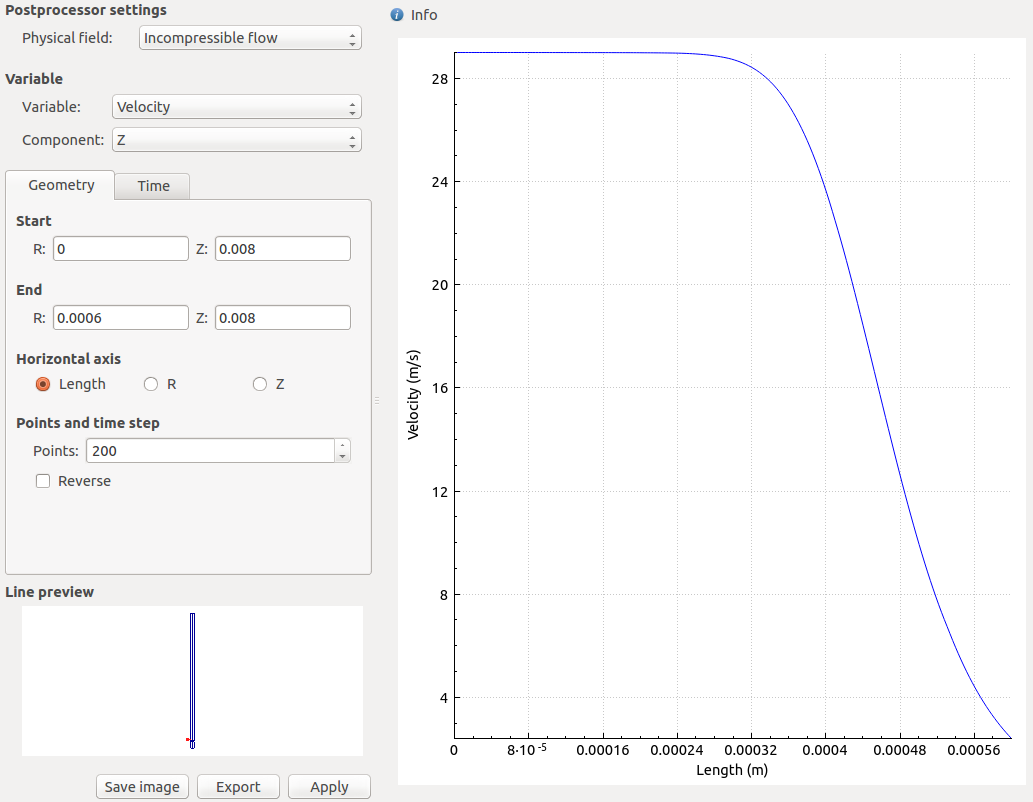
This the velocity profile at the center of the throat. It is interesting to see the velocity is in a step shape. The velocity is constant in the stream and near zero otherwise.
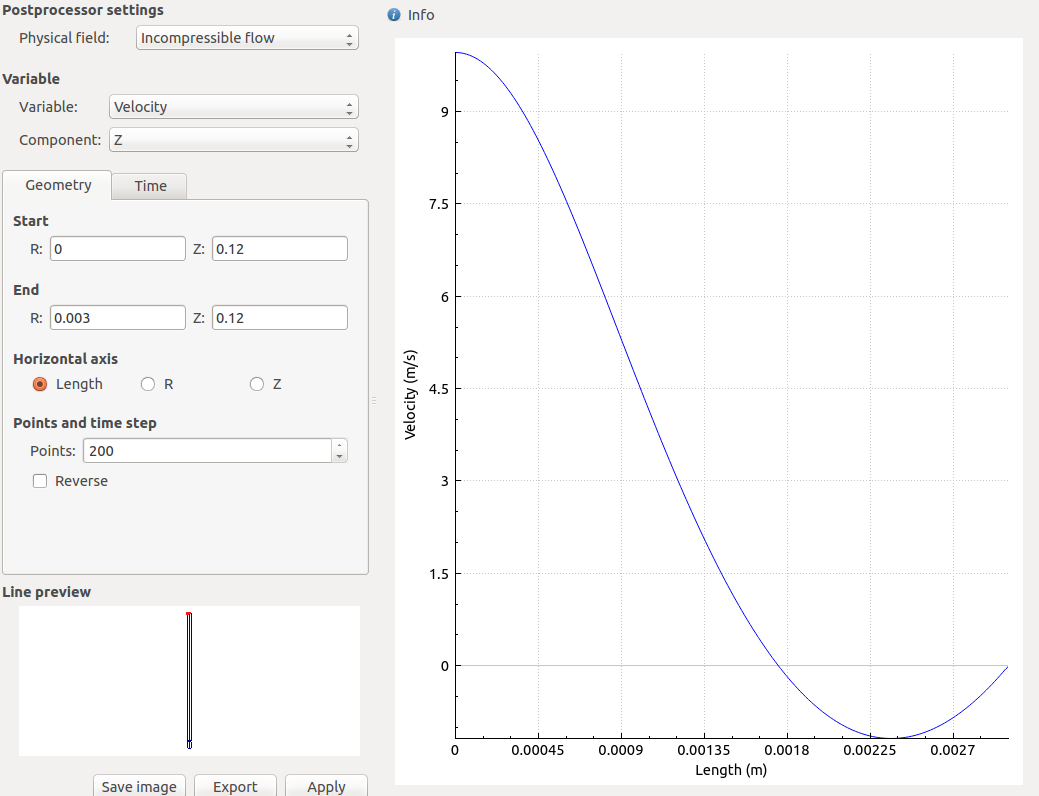
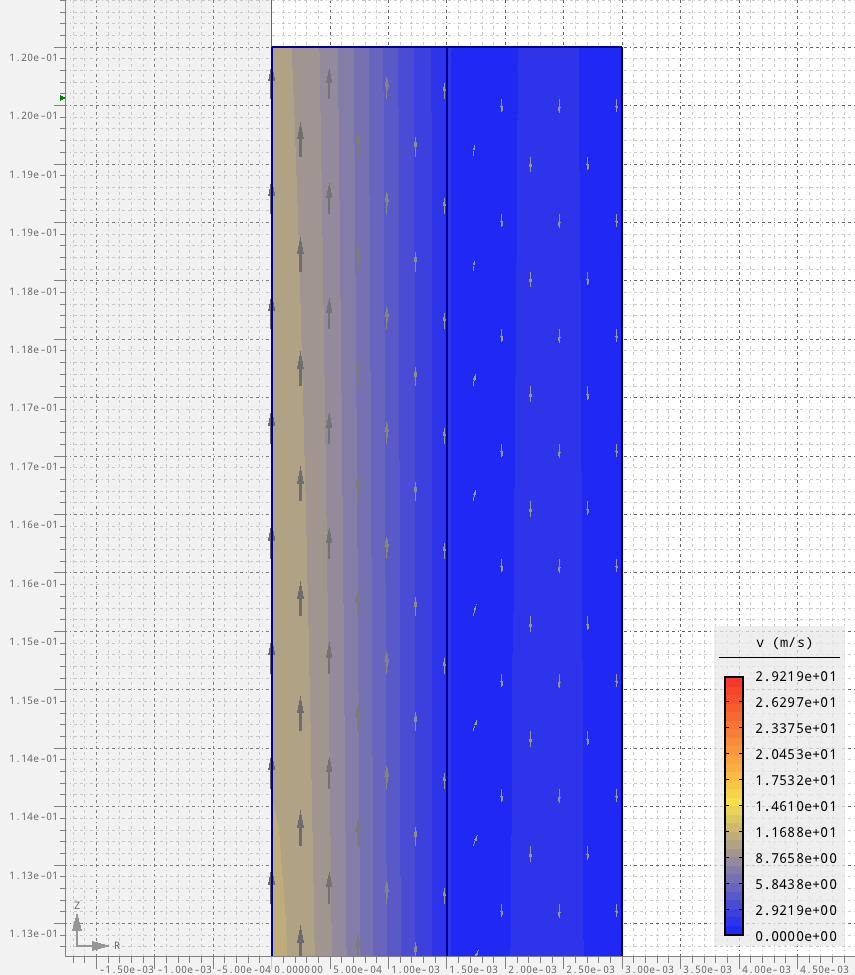
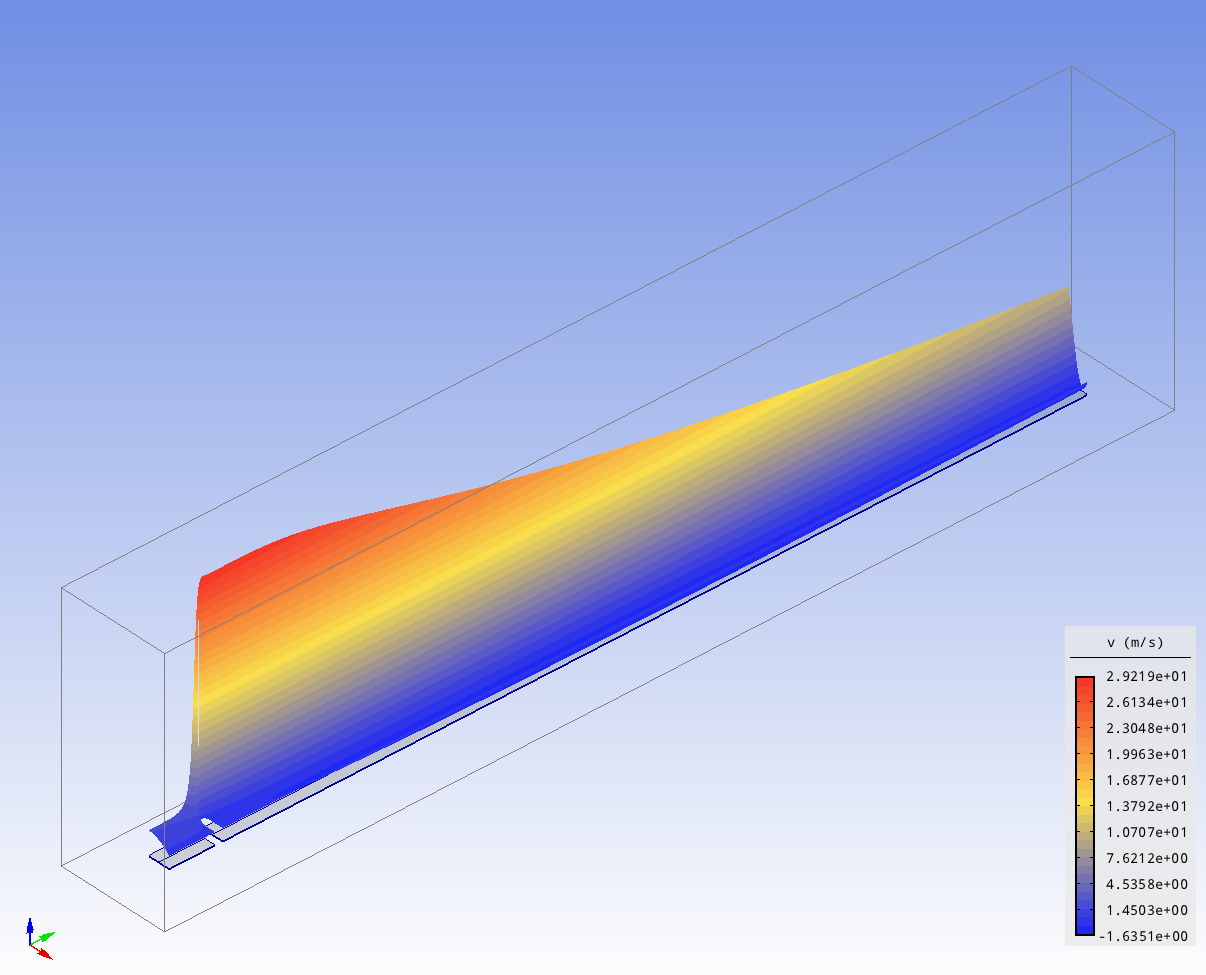
Velocity profile at the outlet in the z direction which along the axis of the pipe. Notice the negative velocity part of the profile indicating recirculation.
Hopefully you enjoyed this as much as I did making it.
